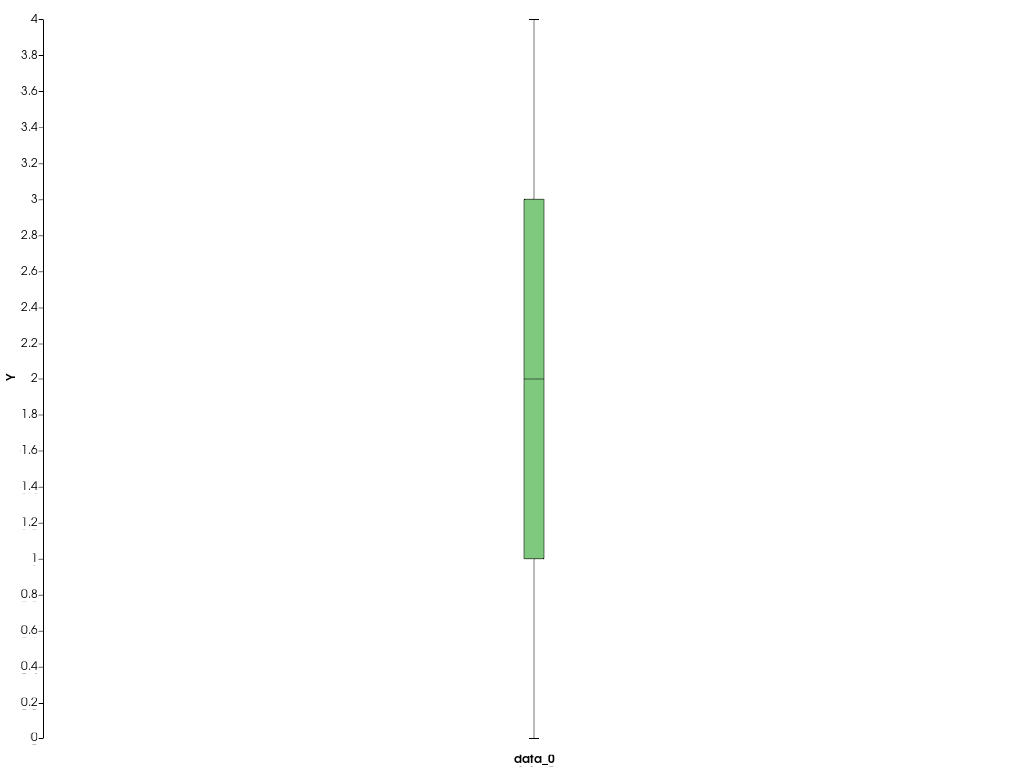
pyvista.ChartBox.visible# property ChartBox.visible[source]# Return or set the chart’s visibility. Examples Create a boxplot chart. >>> import pyvista as pv >>> chart = pv.ChartBox([[0, 1, 1, 2, 3, 3, 4]]) >>> chart.show() Hide it. >>> chart.visible = False >>> chart.show()